
A flat base is a chart pattern that often forms after a stock has experienced a move up in price. It is characterized by a period of consolidation, where the stock’s price trades within a relatively tight price range. The pattern typically lasts at least five weeks, and the ideal buy point occurs when the stock price rises above the high point of the consolidation area. Flat bases are considered bullish chart patterns and can signal a potential breakout to new highs.
When trading based on a flat base pattern, the best time to enter a trade is when the stock breaks out from the flat base. This breakout should ideally be accompanied by above-average volume, indicating strong investor interest. Entering the trade as soon as the stock price moves above the buy point of the flat base can be a prudent strategy. Keep in mind that it’s important to use stop-loss orders to manage risk in case the trade doesn’t work out as expected.
Buying a breakout from a flat base can be a promising strategy for investors, but it also comes with certain risks. Here are some factors to consider:
- False Breakouts: One of the primary risks is the potential for a false breakout, where the stock price briefly moves above the buy point but then retreats back into the base. This can lead to buying at an inflated price and subsequent losses.
- Market Volatility: Breakouts from flat bases can coincide with increased market volatility, which may amplify the risk of sudden price reversals.
- Timing: Timing the breakout is crucial, and mistiming the entry can lead to poor performance or losses. It’s essential to have a clear understanding of the stock’s trading range and volume patterns.
- Market Conditions: Economic and market conditions can impact the success of breakout trading, as broad market trends can influence individual stock breakouts.
- Overextension: After a prolonged advance, a stock may become overextended, making it more susceptible to a correction or pullback.
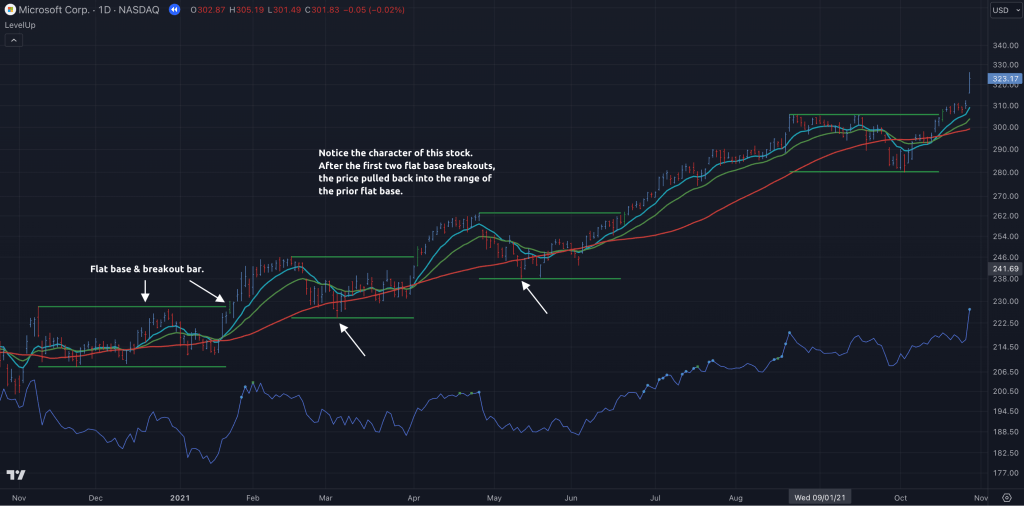
Flat Base Examples in LevelUp
LevelUp has automatic detection of flat bases. You can configure the following:
- Maximum depth – the default is 15%.
- The minimum length – the default is 10 bars on a daily chart and 5 bars on weekly.
- Color of the breakout bar when price moves above the high of the flat base.

You must be logged in to post a comment.