
A 52-week high, in the context of trend following, refers to the highest closing price of a security or asset within the past 52 weeks. Trend followers often use the 52-week high as a signal to identify assets with upward momentum, considering it as an indication of a potential trend continuation. This approach assumes that assets that have reached a 52-week high are more likely to experience further price appreciation.
Traders use the 52-week high in various ways to inform their trading decisions:
- Momentum Trading: Some traders use the 52-week high as a signal to identify stocks with strong upward momentum. They may initiate trades in the direction of the trend, expecting the momentum to continue.
- Support and Resistance Analysis: The 52-week high can act as a psychological level of resistance. Traders incorporate this information into their analysis to anticipate potential price reactions at this level, such as breakouts or reversals.
- Trend Confirmation: Traders may use the 52-week high to confirm the strength of an existing trend. If a stock breaks out to a new 52-week high, it can provide confirmation of the underlying bullish trend and prompt traders to enter or add to existing long positions.
- Stop Loss Placement: When holding long positions, traders often adjust their stop-loss orders based on the 52-week high. They may raise stop-loss levels as the stock price moves higher, aiming to protect their profits and minimize potential losses.
- Market Sentiment Analysis: Tracking stocks that are approaching or reaching their 52-week highs can provide insights into market sentiment. Traders evaluate the behavior of these stocks to gauge market optimism or pessimism.
- Contrarian Indicators: For some traders, the 52-week high can serve as a contrarian indicator. They may look for overextended stocks at their highs as potential candidates for short positions, anticipating a reversal or pullback.
52-Week High Configurable Options in LevelUp
- Show on daily and/or weekly chart
- 52 week high symbol location:
- Above Bar
- Below Bar
- Top of Chart
- Bottom of Chart
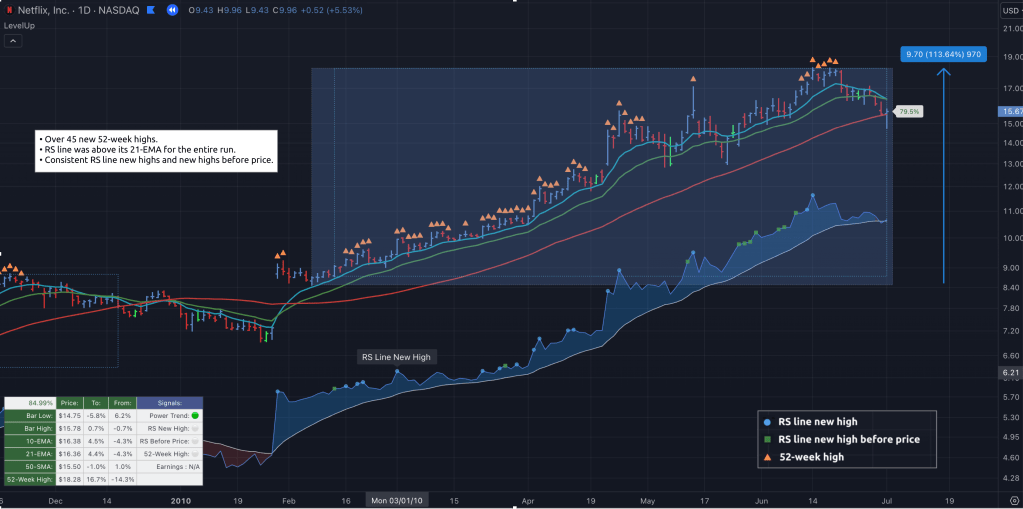
52-Week High Example ~ NFLX
In 2010, NFLX reached a new 52-week high over 45 times. That’s impressive!
Remember, while the 52-week high can be a valuable tool in trend following, it should be used in conjunction with other technical patterns/signals and not in isolation.
You must be logged in to post a comment.