
The RS line is a technique to measure the relative strength of a stock or other financial instrument against a market index. It is calculated by dividing the performance of an asset by the performance of a comparable market benchmark. When the RS line is rising, it indicates the asset is outperforming the market. Conversely, when the RS line is falling, it suggests the asset is underperforming the broader market. Breakouts to new highs in the RS line can serve as buy signals, while declines may act as sell signals. Proper analysis and interpretation of the RS line trend can help investors identify relative strength and weakness to make more informed investment decisions.
The LevelUp RS line has several unique features beyond those found on other platforms and tools:
▪ Enhanced tracking of RS line new high and RS line new high before price.
▪ Plotting RS line new high and RS line new high before price as symbols on RS line or along top/bottom of chart.
▪ Custom moving average and moving average cloud to easily identify direction of the trend.
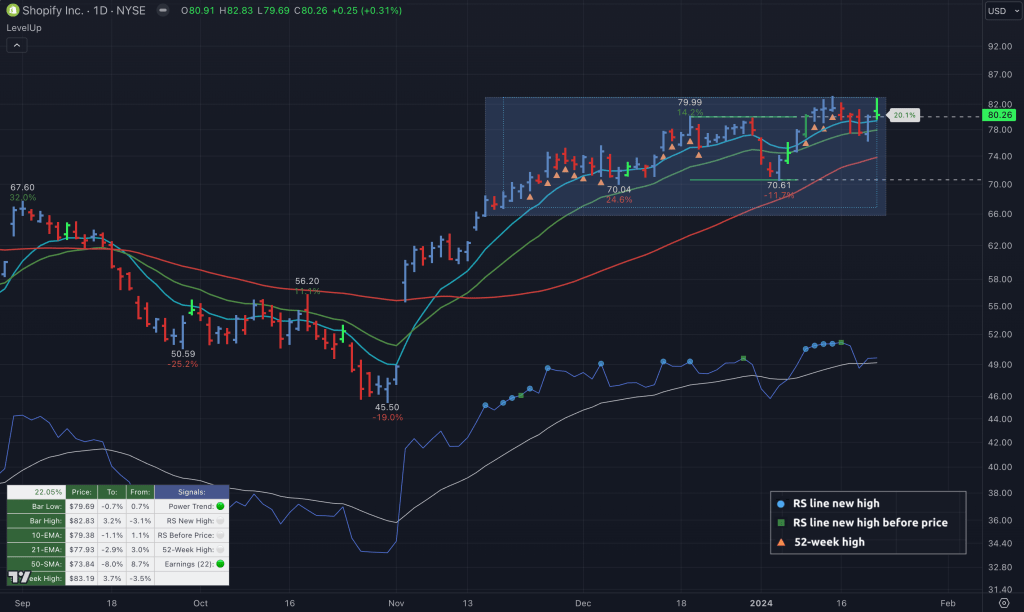
RS Line and the Signals Table
Before we look at the charts, one important note about the Signals table (see the lower left corner on the chart above). You can track the status of the RS line even without the RS line visually shown on the chart. This can be helpful to reduce the noise.
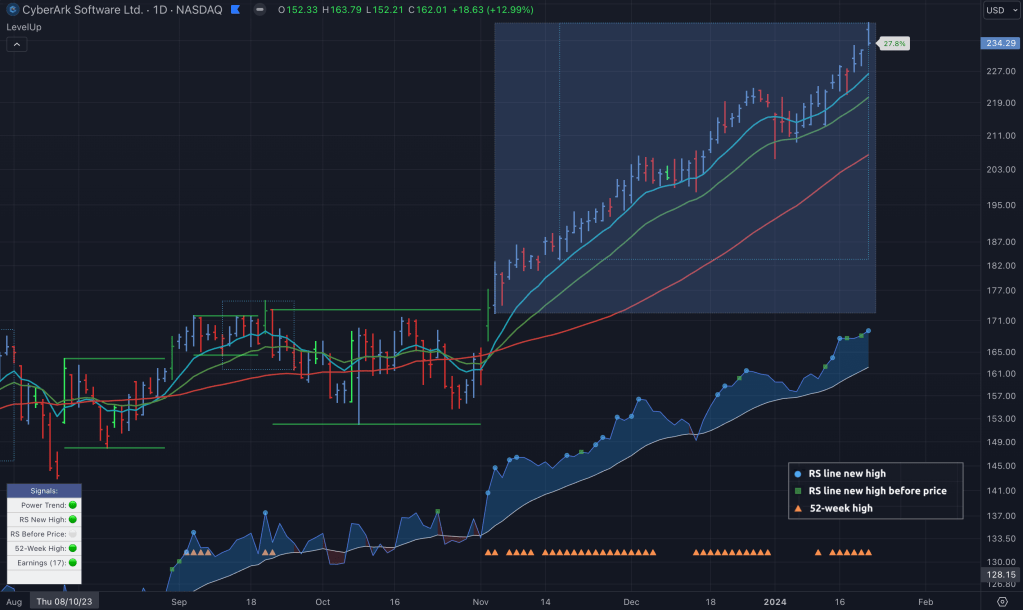
RS Line and 21-EMA Moving Average
Here’s a classic view with the RS line and it’s 21-EMA moving average. Notice when the RS line is above the moving average the trend is up and vice versa.
Symbols representing RS line new high and RS line new high before price are plotted directly on the RS line.
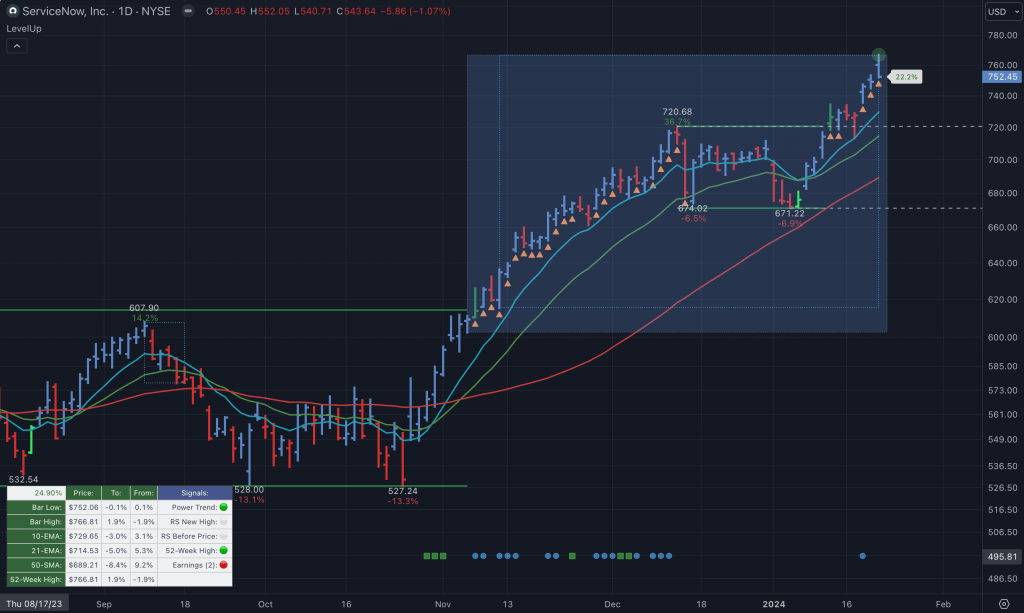
RS Line with Moving Average Cloud and 52-Week Highs
You can configure an optional moving average cloud, which can help to easily visualize the trend. In the following chart, 52-week highs are also plotted along the bottom of the chart.
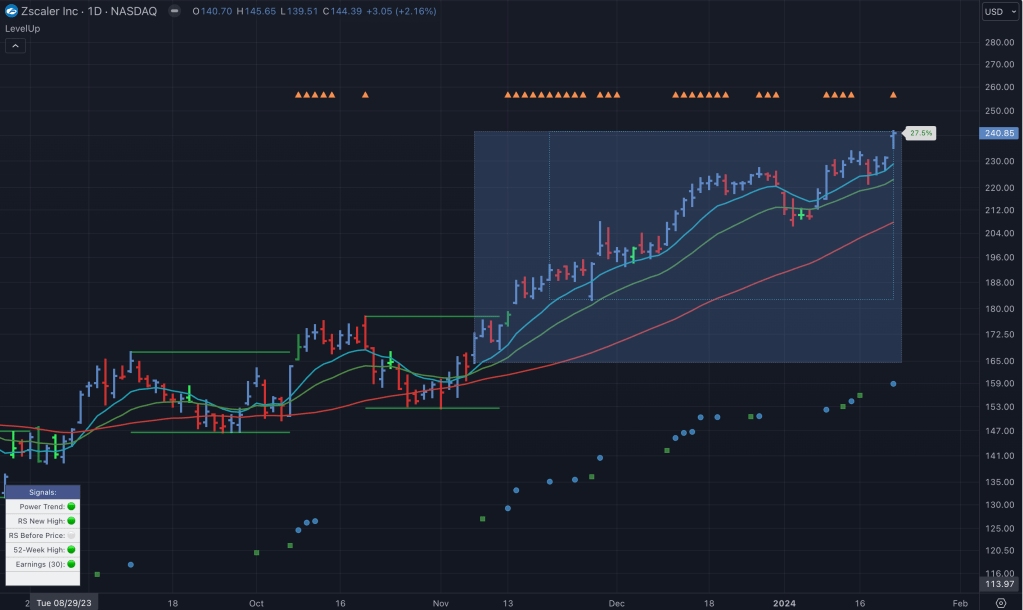
No RS Line – Plot RS Symbols Along the Bottom of the Chart
If you prefer a clean look, you can hide the RS line and plot the relevant signals along the bottom of the chart.
No RS Line – Plot RS Symbols
This is a rather unique look, plotting just the symbols following the trajectory of where the RS line would be.
You must be logged in to post a comment.