Earnings, Sales and Acceleration Statistics

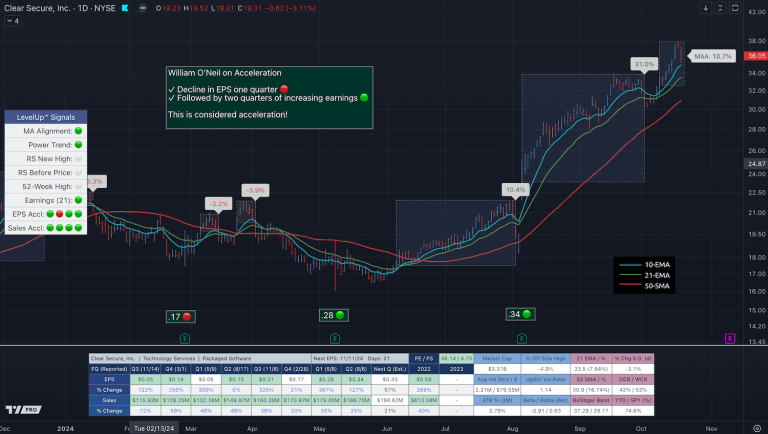
View Detailed Earnings, Sales and Acceleration Metrics

Enhanced Earnings, Sales and Acceleration Statistics In this tutorial I’ll walk through recent updates to the Trend Follower indicator on TradingView, including new features to display of earnings and sales data in addition to earnings and sales acceleration stats. There…

Power Earnings Gap Detection

How To Setup Power Earnings Gap Alerts In TradingView

A Power Earnings Gap (PEG) is a technical pattern, also known as an episodic pivot, that occurs when: This pattern often signals potential bullish momentum for the stock. Receive Alerts When a Power Earnings Gap is Detected in TradingView To…

Power Earnings Gap (PEG)

Ultimate Power Earnings Gap Indicator For TradingView

A Power Earnings Gap (PEG) is a technical pattern that occurs when a stock experiences a significant upward price gap following the release of a strong earnings report. With the Trend Follower indicator you can customize Power Earnings Gap criteria…

Power Trend

The Ultimate Power Trend Tutorial for TradingView

The Power trend was designed by Mike Webster, Charles Harris and Justin Nielsen of Investor’s Business Daily. The goal was to mimic the trading style of IBD’s Founder, William O’Neil, a legendary trader. Whether you trade stocks, ETFs or crypto,…

Earnings and Sales Acceleration

How to Visualize Earnings & Sales Acceleration (And Ride the Trend)

From trading legends, the importance of earnings and sales acceleration: William O’Neil: ✅ “Outstanding earnings and sales acceleration is the most common characteristic of winning stocks.”✅ “Look for stocks where sales are accelerating in their percentage increases.” Mark Minervini:✅ “More than…

Getting Started on the Daily Timeframe

Daily Timeframe ~ Getting Started

The following video is a walk through of the current features available in the LevelUp Trend Follower indicator when working with the daily timeframe. Note: All LevelUp indicators are updated periodically. Given this, you may notice some UI elements are…

RS Line QQGD

The Ultimate RS Line Tools for TradingView

The RS line (relative strength) is included in the Trend Follower indicator, it measures a stock’s performance versus a market index. A rising RS line indicates a stock is outperforming the overall market. Mike Webster, previously a Portfolio Manager at…

Marked Highs and Lows

Show Only The Most Recent Marked High and Low

In version 2.5 of the LevelUp^ Trend Following indicator for TradingView, you can choose to show only the most recent marked high and low, which can help to reduce the noise on the chart. Here’s a quick demo on how…

Require upward trending moving averages

Require Upward Trending Moving Averages for MAA

With the release of version 2.4 of the LevelUp Trend Following indicator for TradingView, you can now require MA 1 and/or MA 2 to be in an uptrend as requirements for moving average alignment to begin. I’ve found this new…