
When a power trend is active, there is a stronger than usual uptrend underway. The concept of a power trend was defined by Investor’s Business Daily, more specifically, their Market School course designed to mimic the trading style of IBD’s Founder, William O’Neil.
What Starts a Power Trend?
■ Low is above the 21-day EMA for at least 10 days.
■ 21-day EMA is above the 50-day SMA for at least five days.
■ 50-day SMA is in an uptrend.
■ Closes up for the day.
What Ends a Power Trend?
■ 21-day EMA crosses under 50-day SMA.
■ Close 10% below recent high and below the 50-day SMA.
Good new is, LevelUp will automagically find and highlight power trends on daily charts! In addition, the percent change in price can be shown when exiting a power trend.
Configurable Power Trend Settings
■ Show a box around each power trend.
■ Configure the box border, width and style.
■ Display the % change in price from the start of a power trend.
■ Show a symbol along the top or bottom of the chart each day a power trend is active.
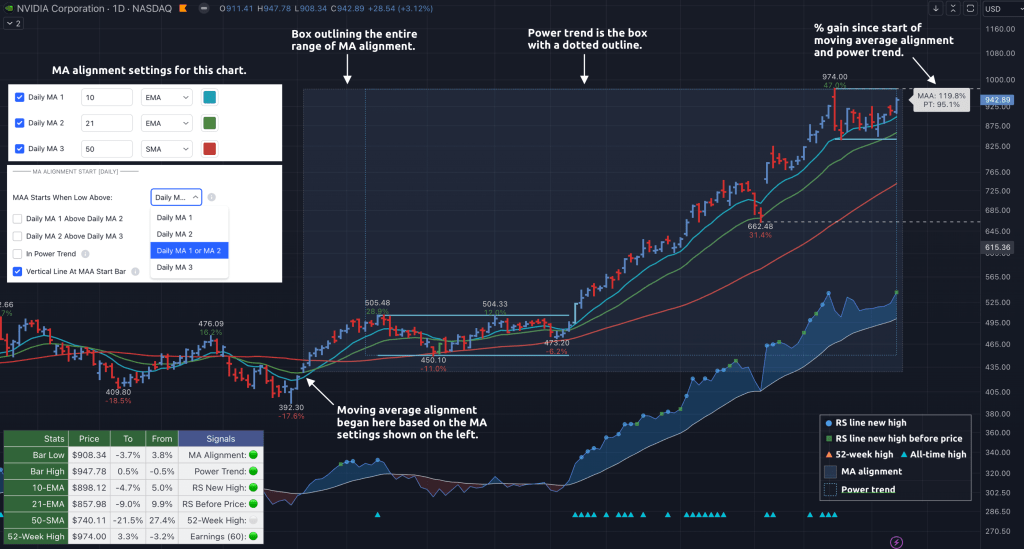
Compare the Power Trend to Moving Average Alignment
The other prominent box that is often shown on LevelUp is the moving average alignment box, shown below.
You must be logged in to post a comment.