
Trend Alignment Pro

Trend Alignment Design Goals
Trend Alignment is an all-in-one collection of the most popular trend following tools merged into one indicator. Trend Alignment automates many aspects of technical analysis to find and highlight chart patterns and signals based on the principles of William O’Neil, Stan Weinstein, Jesse Livermore and other well-known trend followers.
Trend Alignment uses the term Moving Average Alignment™ to refer to patterns that meet your specific requirements as it relates to moving averages and their relationship to price and one another. For example, you can request the start of MA alignment begin when the low is > 21-EMA, the 21-EMA is > 50-SMA and the 50-SMA is trending up. There is a wide range of configuration options for MA alignment, including customization of the moving average types (SMA or EMA) and lengths.
Trend Alignment includes tools and signals for intraday, daily and weekly timeframes.
Trend Alignment goes beyond being a mere “buy here, sell there” indicator. It serves as a comprehensive set of tools tailored for dedicated traders with a strategic approach to trading, a known timeframe, are adept risk management, and on are a quest for resources that can identify and highlight technical chart patterns and signals. If you’re weary of unreliable indicators making false claims and instead look for tools crafted with an emphasis on trend following, you’ve come to the right place.
Daily Charts
▪ Configure Moving Average Alignment™ and preferred price action
▪ Custom RS Line:
▪ Symbol overlays showing new RS highs
▪ Custom moving average with optional cloud
▪ View 10-week SMA on daily chart
▪ Set exit criteria based on moving averages and % below entry
▪ Stats table to simplify calculating entry/exit points.
▪ Marked highs/low (support and resistance).
▪ Highlight breakout above most recent pivot high.
▪ Signals table to quickly view if stock is trending up
▪ Visualize potential add points based on % gain from entry
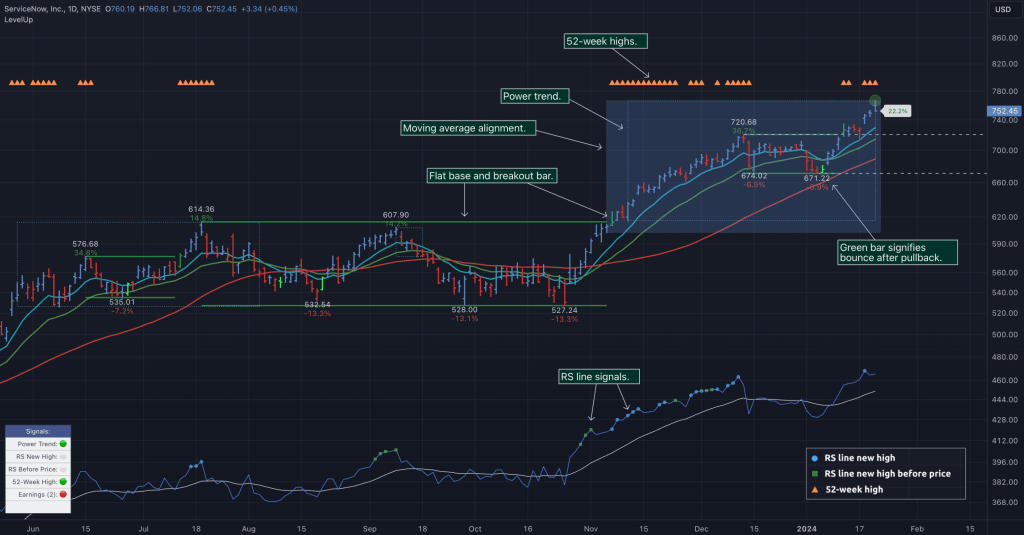
▪ Power Trend tools and analysis


Weekly Charts
▪ Flat base detection with custom configuration.
▪ Consolidation detection with custom configuration.
▪ Highlight lower close/lows (pullbacks).
▪ Marked highs/low (support and resistance).
▪ Highlight breakout above most recent pivot high.
▪ Highlight 52-week highs.
▪ Customizable tight closes.
▪ Customizable up weeks.
▪ Additional patterns in future releases.


Intraday Charts
▪ View daily 10-EMA, 21-EMA and 50-SMA.
▪ AVWAP 1-day and 2-day.
▪ AVWAP 5-day moving average.
▪ Marked highs/low (support and resistance).
▪ Custom moving averages.

RS Line▪Relative Strength
The RS Line compares a stock’s performance to the S&P 500 index. A rising RS Line means the stock is outperforming the overall market. Another important signal is when the RS Line reaches a new high before price. When this occurs, it indicates strong demand for the stock and may precede a significant price increase as buyers accumulate shares. Both signals are customizable within LevelUp providing multiple visual cues when the required conditions are met.
LevelUp also adds a few unique visuals as it relates to the typical RS Line. Included are options to show symbols on the RS line that represent RS Line new high and RS Line new high before price. This provides an at-a-glance view of the trend. Additionally, LevelUp allows for custom moving averages to be applied to the RS Line as well as an optional cloud to help identify support/resistance levels.


Power Trend
When a power trend is active, there is a stronger than usual uptrend underway. The concept of a power trend was created by Investor’s Business Daily (IBD) based on extensive backtesting and historical analysis.
A power trend by definition uses a major index, such as the Nasdaq Composite (IXIC), as the data source for determining a power trend’s state, either off or on. The LevelUp indicator builds upon this concept by allowing the current active chart symbol to be the data source for the Power Trend.
What Starts LevelUp Power Trend?
▪ Low is above the 21-day EMA for at least 10 days.
▪ 21-day EMA is above the 50-day SMA for at least five days.
▪ 50-day SMA is in an uptrend.
▪ Close up for the day.
What Ends LevelUp Power Trend?
▪ 21-day EMA crosses under 50-day SMA and the close is below prior day close.
▪ Close below the 50-day SMA and low is 10% below recent high.

AVWAP – Anchored VWAP
The Anchored Volume Weighted Average Price (AVWAP), created by Brian Shannon, is used to assess the average price at which an asset has traded since a specific event or milestone. This could be the beginning of a trading day, the release of important news, or any other event deemed significant. By anchoring the VWAP to a specific point in time, it helps market participants analyze how prices have evolved relative to that anchor.
If a stock is above a rising AVWAP, buyers are in control, while a declining AVWAP indicates sellers are in control. By analyzing AVWAP, traders can make informed decisions on timing entries, managing losses and profits, or deciding to stay on the sidelines during periods of market indecision.


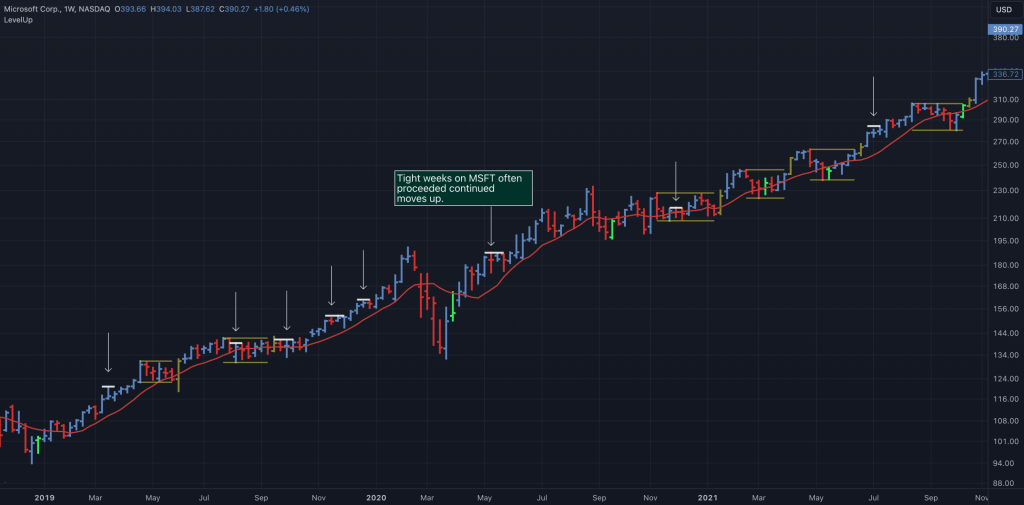
Tight Weeks And Up Weeks
William O’Neil primarily focused on weekly charts. Two common patterns he looked for were tight weeks and up weeks.
Tight price action occurs when there are small price variations from week to week. This indicates a lack of supply and accumulation by institutions. With LevelUp you can configure the minimum number of weeks and the maximum % change in price.
Up weeks are defined as multiple weeks where each close is higher than the previous week. This pattern is often a signal of institutional buying. At a minimum, O’Neil looked for three weeks of upward price action. You can configure the minimum number of up weeks required.

Flat Base
A flat based is relatively tight price action within a range. A flat base takes 5+ weeks (25+ days) to form. Although flat bases are often found after a more significant advance in price, this isn’t always the case. With that in mind, LevelUp does not currently have requirements for a prior uptrend while scanning for flat bases.
In a flat base, price declines should be no more than 15% from intraday peak to trough. This is an important distinction, as with a consolidation (se below) the maximum depth is based on the high of first bar that started the base.
Default Requirements:
▪ Daily minimum length: 25 days
▪ Weekly minimum length: 5 weeks
▪ Depth maximum: 15% (daily or weekly)
▪ Values can be customized

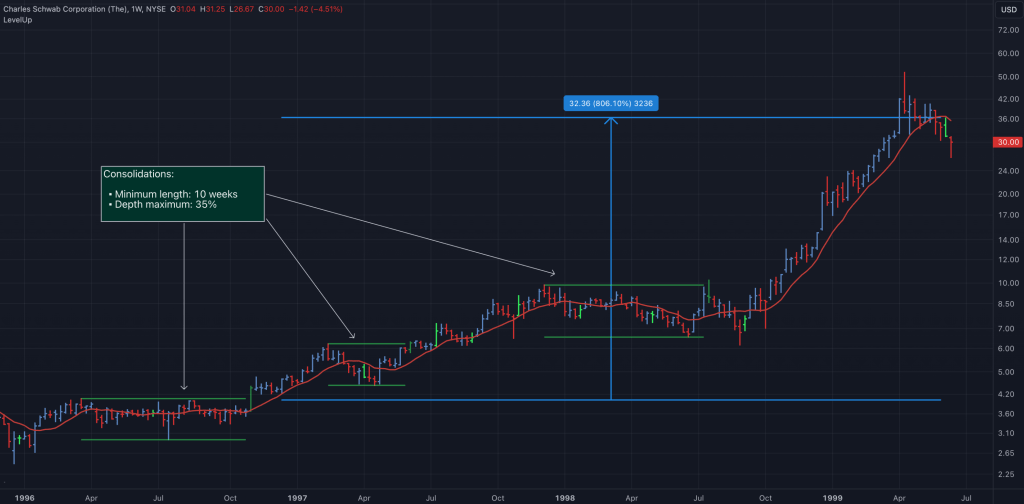
Consolidation
A consolidation differs from a flat base in that the former can be much deeper and last longer. In addition, the fluctuations in price of a flat base are often tighter than a consolidation.
Unlike a flat base, the maximum depth is calculated from the high at the start of the consolidation. The decline can be as much as 50%. The minimum length and maximum depth can be customized for all flat base and consolidation patterns.
In a flat base, price declines should be no more than 15% from intraday peak to trough. This is an important distinction, as with a consolidation (se below) the maximum depth is based on the high of first bar that started the base.
Default Requirements:
▪ Daily minimum length: 30 days
▪ Weekly minimum length: 6 weeks
▪ Depth maximum: 35% (daily or weekly)
▪ Values can be customized
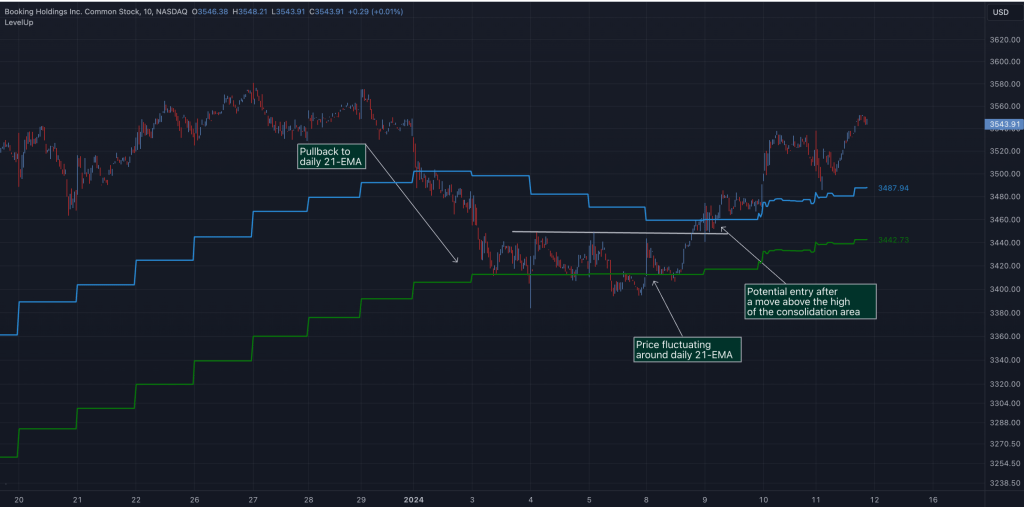
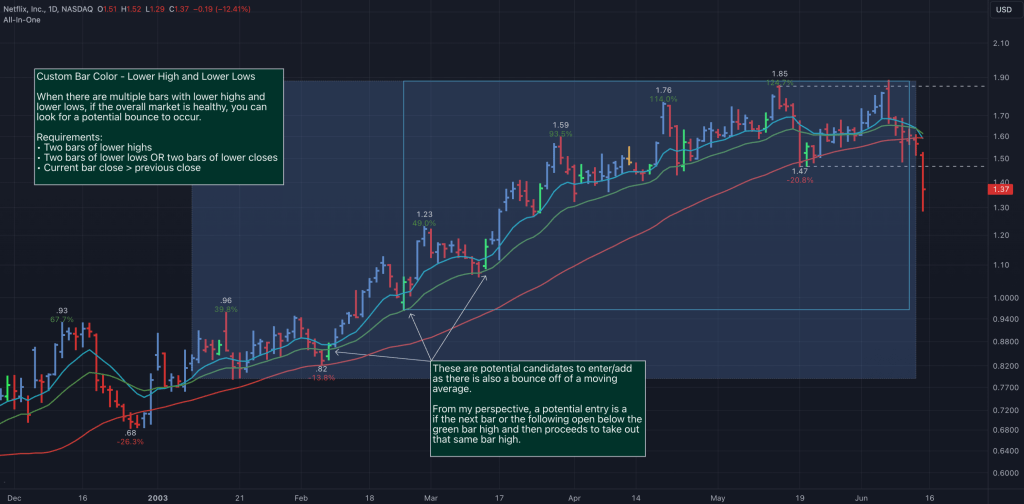
Pullback In Price And Potential Bounce
A pullback occurs when the price declines after an initial advance. This is normal price action as prior support levels are tested. Pullbacks also act as a way to shakeout weak holders before the primary trend resumes.
With LevelUp you specify the type of pullback to track: lower lows, lower closes or both. You also set the minimum number of bars required. Different values can be set for daily and weekly charts. Once your requirements are met, LevelUp will highlight the bar after the pullback is complete. This is often a potential entry/add point.
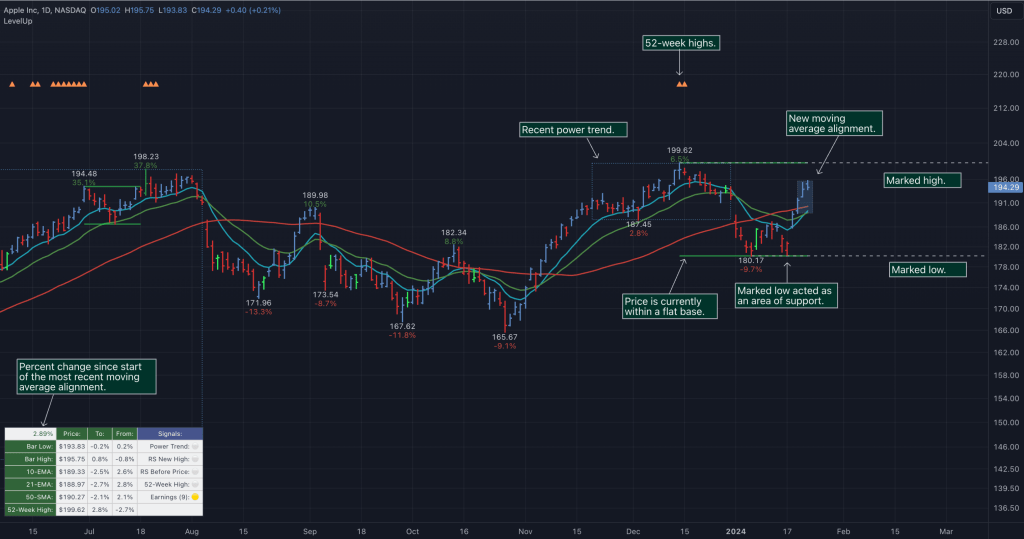
Marked Highs And Lows
Marked highs/lows, often referred to as pivot highs/lows, can be used to find areas of potential support and resistance. As defined by William O’Neil, on a daily chart, a marked high is the highest high going back nine bars and forward nine bars. The number of days forward/backward is referred to as the period. The same concept applies to finding marked lows.
One benefit of LevelUp marked highs/lows is that you can customize the high and low periods on all timeframes.
There is an additional option when viewing marked highs/lows to see where a breakout occurs. The highlight is shown if the current bar high is above the most recent pivot high.

Comparing Stock Performance
With two or more copies of LevelUp installed, you can configure different settings and compare and contrast how indicators and signals perform relative to one another.
This is a great way to come up with your own custom layout for each timeframe, tailored to your preferences and trading style.

Stats And The Signals Table
The stats and signal tables can be very helpful to see price information and patterns at a glance. For example, you can quickly determine potential stoploss placement based on the distance to/from a moving average. The signals tables show the status of several key trend indicators, including 52-week highs, RS Line new high and RS Line new high before price.

Managing Long Term Trends
Depending on your trading style, there are many ways to take advantage of long term trends. For example, the chart that follows show how an uptrend can be a profitable trade whether holding for the duration or taking shorter term trades along the way.
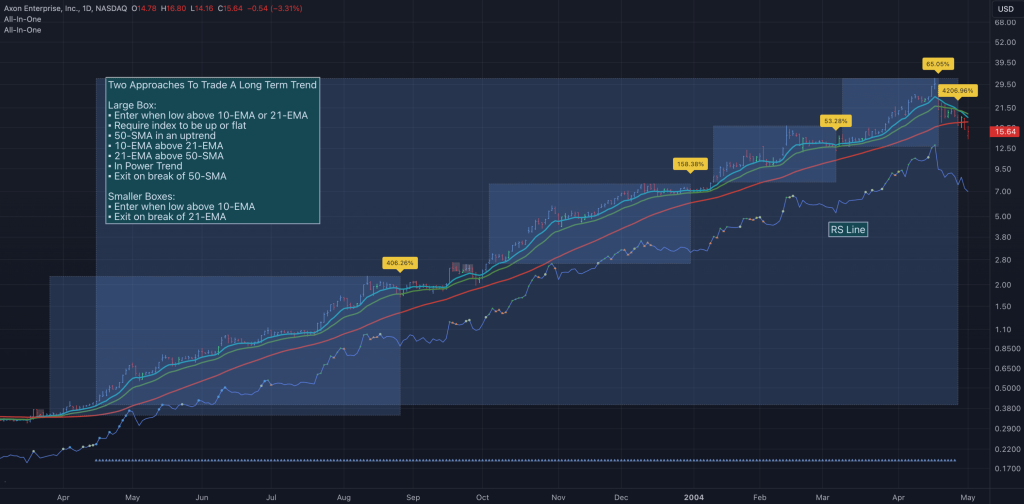
Safeguard your capital. Always have a stop 🛑.
LevelUp indicators are for informational and educational purposes only. Do your own research before making any trade decisions. We accept no liability for any loss or damage, including without limitation any loss of profit, which may arise directly or indirectly from use of or reliance on LevelUp indicators.
You must be logged in to post a comment.