Free Indicators
22 free indicators and screeners on TradingView.
New scripts are added regularly, so check back often.

Darvas Box MTF Trend Tracker
Nicolas Darvas's box theory across multiple timeframes, with alerts and screening options.

Moving Averages For All Timeframes
Manage separate moving averages for intraday, daily, weekly and monthly charts from one indicator.

Earnings, Sales & Volume Dashboard
Quarterly EPS and sales data with visual cues comparing each quarter.

Ants - Momentum, Volume & Price
The original Ants indicator, based on the research of David Ryan, highlighting strong price and volume action.

RS Line - Relative Strength Line
A classic Relative Strength Line comparing a stock's performance with a benchmark index.

Minervini Trend Template Screener
Screens for stocks in strong uptrends based on Mark Minervini's Trend Template.

3 Weeks Tight - Price Consolidation
Highlights 3 weeks tight, the bullish continuation pattern identified by William O'Neil.

5-Day Moving Average - Intraday
Built with Brian Shannon: plots the 5-day moving average correctly on any intraday timeframe and market.

Marked Highs - Support & Resistance
Marks significant highs and lows as support and resistance, in the style of MarketSmith charts.

Volume Positive Negative (VPN)
Markos Katsanos's VPN indicator for spotting volume-backed breakouts.

Relative Volume - Real-Time Volume
Compares volume at this point in the session with prior volume at the same time of day.

RS Line New High Screener
Finds stocks outperforming the S&P 500, where the Relative Strength Line is making new highs.

Mini Coil With Real Range
Highlights mini coils, a low-risk setup where volatility tightens within a longer-term pattern.

Power Trend Detector
Flags when a Power Trend, a stronger-than-usual uptrend defined by IBD, is underway.

Relative Strength MA Crossover
Combines a moving average crossover with the Relative Strength Line to confirm trend changes.

Volume & Configurable Moving Averages
Volume bars with configurable moving averages that adapt to the chart timeframe.

Market Sentiment Trend Gauge
Combines momentum, trend direction, volatility and market comparison into a single trend score from -100 to +100.
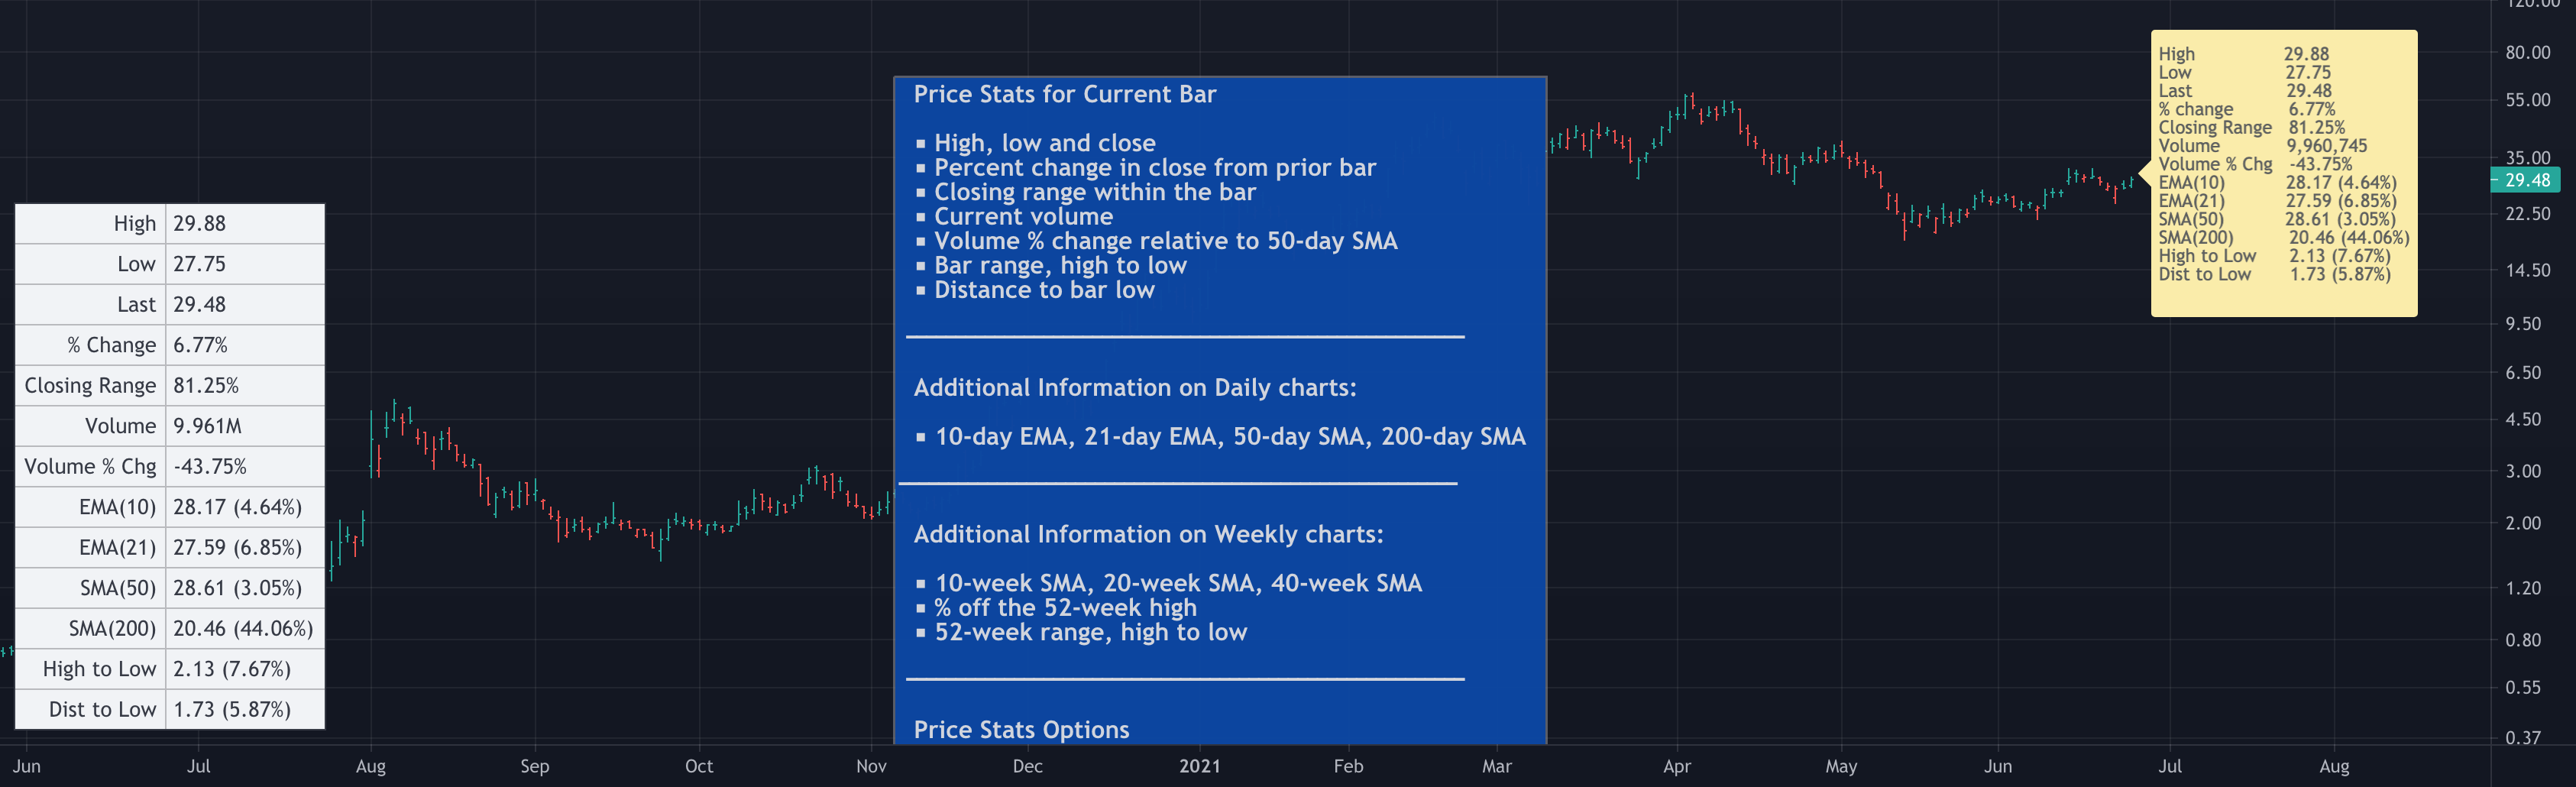
Price Stats / Price Data
Key price, volume and moving average stats for the latest bar, in the style of MarketSmith.
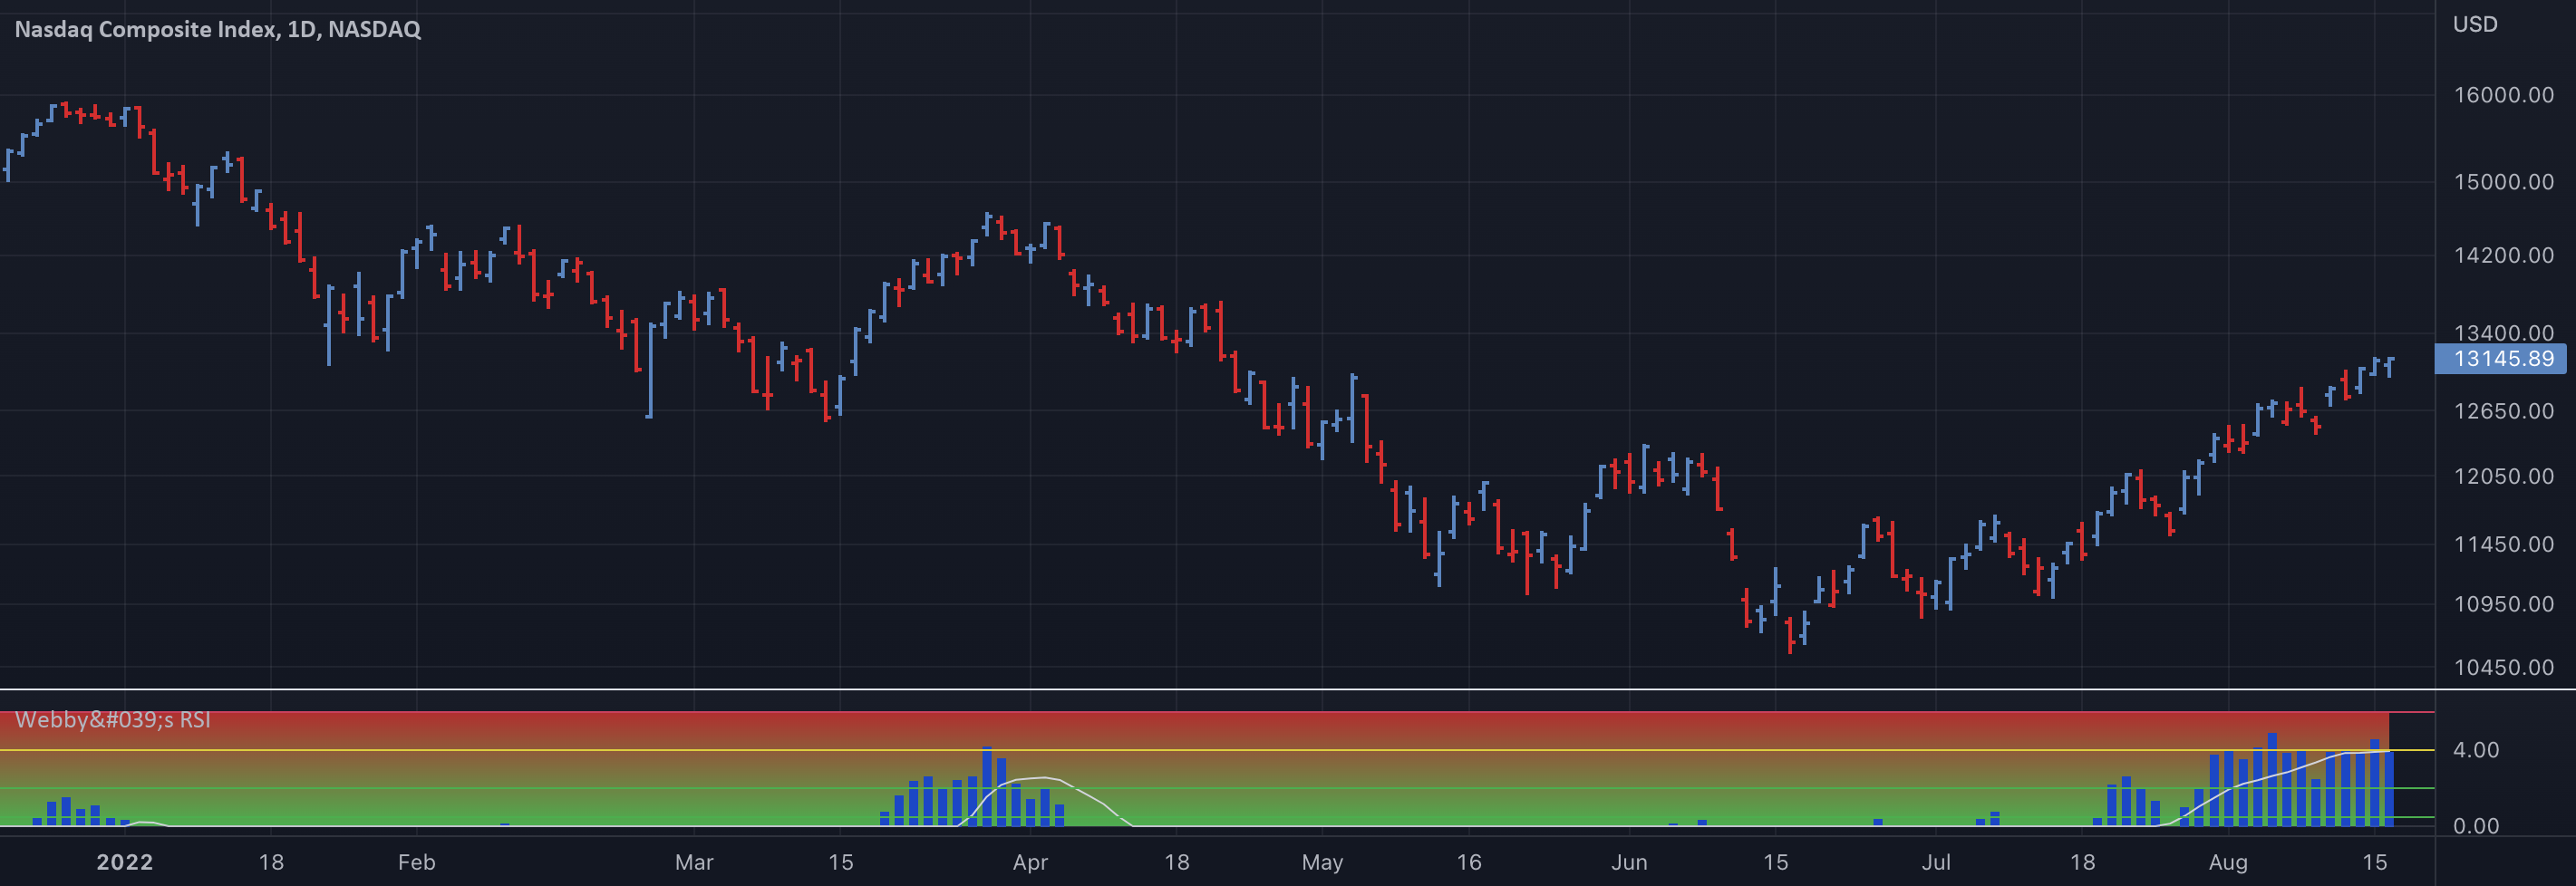
Webby's RSI (Really Simple Indicator)
Webby's Really Simple Indicator for gauging how extended price is from its trend.

Power Trend Screener
Screens stocks, ETFs and crypto for an active Power Trend using the Pine Screener.

Upside Reversal Screener
Finds strength in a weak tape: stocks that undercut a prior low and rallied to close strong.

Up On Volume Screener
Finds stocks closing higher on a significant volume spike, with filters for closing range and distance from the 52-week high.