
Earnings Line – EPS Tracker
Earnings Line Design Goals
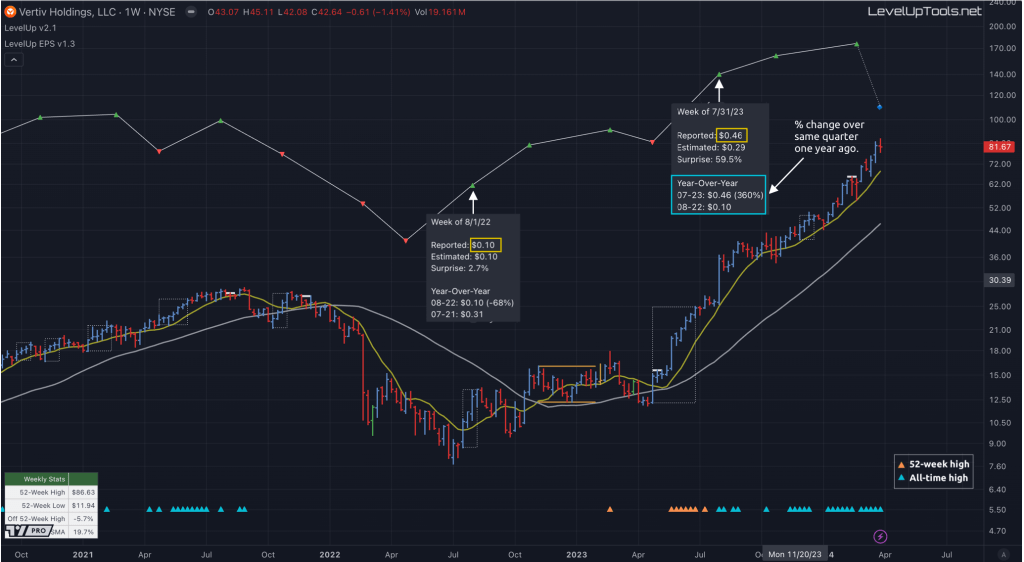
Earnings are a foundational concept that can have a significant impact on a stock’s longer term performance. With the option to view earnings as a plot versus a table of statistics, you can quickly identify earnings acceleration or deceleration. A steep line upwards from one earnings release to another, or a series of progressively higher EPS values, indicates a strong earnings trajectory. The more pronounced the acceleration, the more likely the company is to outperform the market.
With the Earnings Line indicator, at each quarterly earnings release you can view the details for Reported (non-GAAP), Diluted and Basic EPS by hovering over the plotted symbols on the earnings line.
This indicator uses TradingView’s financial functions to request the following EPS data:
▪ Reported (non-GAAP): this is one of the most popular ways to view earnings information. With non-GAAP, companies often exclude nonrecurring charges such as acquisitions and restructuring costs as these items are often not indicative of a companies overall performance.
▪ Basic: net income minus preferred dividends divided by the average number of common shares outstanding.
▪ Diluted: net income minus preferred dividends divided by the average number of common shares outstanding & convertible preferred shares such as convertible debt, equity options and warrants.
Monthly Charts
Although the quarterly earnings data is the same across all timeframes, viewing the longer term trend versus the shorter term trend is relevant based on the objectives of the investor. For example, the earnings growth on a monthly chart provides the big picture view, which may span years. This can be helpful for investors interested in more of a buy and hold approach.
Weekly Charts
The earnings trend on weekly and daily charts has fewer data points simply based on the shorter timeframe. This information is helpful for investors who are more focused on trades that may be weeks or months in length. The momentum and direction of the current earnings trend is of great importance for those looking to ride the current trend.
Earnings Line on Main Chart
It is possible to overlay the earnings line onto the main chart.
▪ Click on the indicator name on left side of the chart.
▪ Select the “…” option.
▪ Use the “Move-to” option to change the location of the earnings line.
▪ To hide the EPS scale on the left, select the “…” option.
▪ In “Pin to scale” select the “No scale (fullscreen)” option.
The one caveat to be aware of is plotting on the price chart is that the price scale will become the default for scaling of the earnings line. This can result in what looks like significant changes between quarterly earnings values, in both directions. For more accurate representation of changes between earnings, it’s recommended to show the earnings line in a separate pane.
Safeguard your capital. Always have a stop 🛑.
LevelUp indicators are for informational and educational purposes only. Do your own research before making any trade decisions. We accept no liability for any loss or damage, including without limitation any loss of profit, which may arise directly or indirectly from use of or reliance on LevelUp indicators.
You must be logged in to post a comment.