
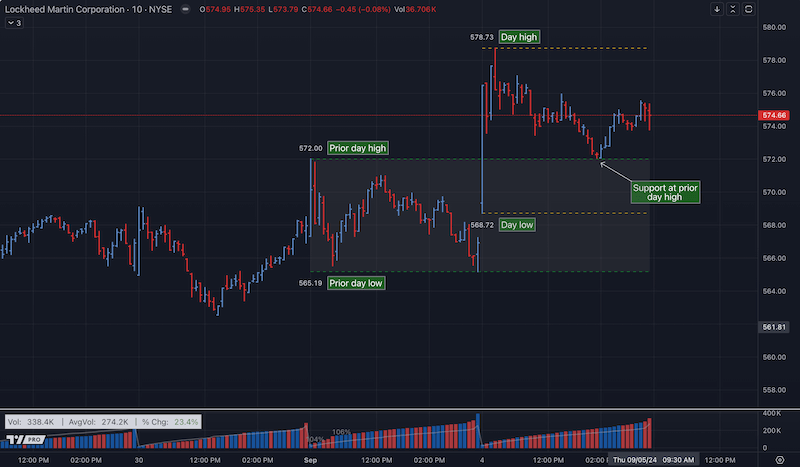
The latest updates to the Alpha indicator are based on my deep-dive into the significance of the prior day’s high and low as potential areas of support and resistance. Much of this analysis is thanks to the work of Linda Raschke, a professional trader with an impressive track record. Linda was a top performing hedge fund manager who began her career as a floor trader. Linda has been featured in numerous books including Jack Schwager’s New Market Wizards.
Here are a few quotes from Linda that are relevant as it relates to prior day’s high and low:
“If I could trade with only one indicator, it would be with the previous day’s high and low. The reason why they are so important is this is where support and resistance come in and they are also the most visible chart points for all market participants. They are very strong psychological markers.”
“The prior day’s high and low and today’s open have very strong psychological implications and are the most important “pivot points” to recognize. Many times the market will let us know right away if this is going to be an area of support or resistance.”
“By concentrating on price action near these points, we can eliminate much of the hard work in tape reading.”
Version 1.8 of the Alpha indicator for TradingView offers several new customization options to easily track highs and lows.
The video below highlights the most recent updates to the Alpha indicator for creating your own custom look to track the highs and lows as well as several examples to help identify areas of support and resistance, living above and below lows and highs, areas of indecision as well as inside days.